
TEVO VWAP: VWAP and standard deviation bands for NinjaTrader 8
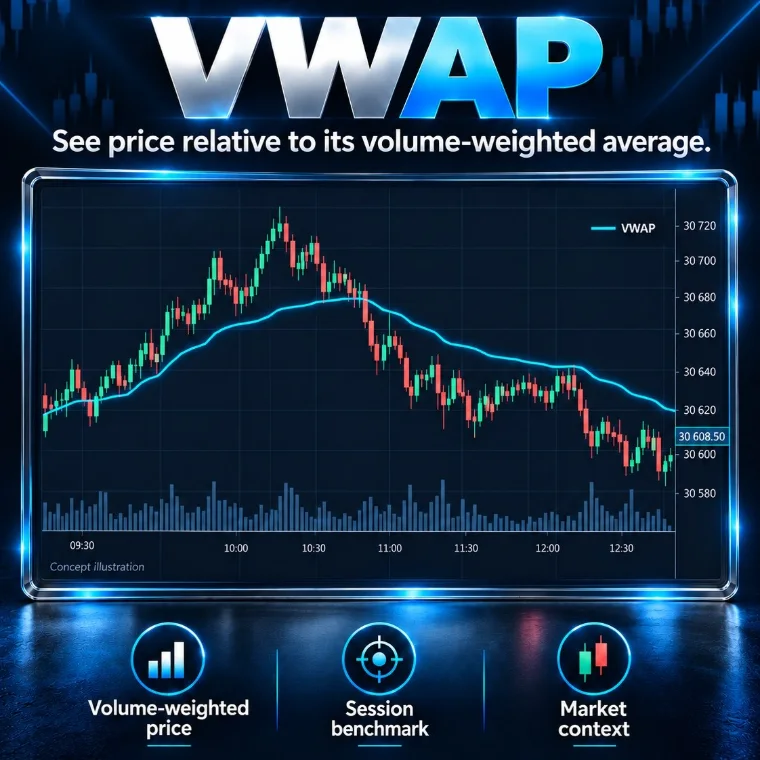
TEVO VWAP calculates the volume-weighted average price since the start of the session, week, month or an anchor point, with three volume-weighted standard deviation bands (×1, ×2, ×3). With Tick Replay, every trade enters the calculation at its exact price.
The download takes two steps, from the “Free indicators” section of the home page.
- Platform
- NinjaTrader 8
- File
- NinjaScript (.cs), readable source code
- Calculation
- On every tick (real time)
- Price
- Free
- File updated on
- 8 October 2026
What the indicator does
- Calculation. VWAP = sum (price × volume) ÷ sum of volume since the reset. With Tick Replay every trade counts at its price; without it each bar counts at its typical price (H + L + C) ÷ 3.
- Period. Session (default), week, month, or a VWAP anchored at a chosen time (never reset). New York RTH hours (09:30-16:00) by default, or ETH (the full electronic session, overnight included).
- Bands. Volume-weighted standard deviation of prices since the reset, at ×1, ×2 and ×3 (three bands on by default), with fill between bands; optional Percent mode (fixed % of the VWAP).
- Display. Thick VWAP line, price labels, session start marker, previous sessions kept, header and legend; optional dashboard.
- Alerts. Optional: price crossing the VWAP, price reaching band 2.
Data and markets
- Index futures (ES, NQ…), stocks and any market with meaningful volume. On forex, volume depends on the provider (often tick count), so the VWAP is less representative.
- Intraday timeframes for the session VWAP; week, month and anchored for broader context.
- Calculated on every tick in real time.
Requirements: what is free and what may cost money
- NinjaTrader 8, a desktop platform for Windows. The indicator is free; NinjaTrader is third-party software with its own terms, and it may cost money depending on how you use it (licence, live trading).
- Market data. Prices, volume and market depth come from your connection (broker or data provider). Depending on the exchange and the subscription, this data may be billed: check your provider’s terms.
- Exact history with Tick Replay. Enable “Show Tick Replay” in Tools › Options › Market Data, then tick Tick Replay in the chart’s Data Series window. Your provider must supply tick history with the bid and ask; the chart then loads more slowly.
- Without Tick Replay. The chart bars rebuild the history (typical price), then every live trade is added. Volume source = TickSeries gives an exact history without Tick Replay, at the cost of heavier loading.
Reading example (educational)
After the open, price stretches to the +2 σ band, then comes back to the VWAP, which holds as support on the first return. The bands describe how far price has moved from its weighted average during the session; they do not predict a return.
Settings
Each setting is named exactly as NinjaTrader shows it, with its default value read directly from the source code (.cs).
1. VWAP
| Setting | Default | What it does |
|---|---|---|
| ResetPeriod | Session | Session = every trading session. Week / Month = one VWAP for the whole week / month. Anchored = from the anchor time below, never reset. |
| SessionHours | RTH | RTH = New York regular hours below only. ETH = the chart's full trading hours sessions (overnight included). |
| RTH start (HHMM, New York) | 930 | |
| RTH end (HHMM, New York) | 1600 | |
| Anchor time (chart time) | Today.AddHours(9.5) | Start of the anchored VWAP (ResetPeriod = Anchored). |
| Time reference | NewYorkAuto | NewYorkAuto = New York times (daylight saving handled), converted from the chart time zone. |
| Manual offset (hours) | 0 | |
| Bar price (without ticks) | Typical | Price of a bar when trades are not available : Typical = (H+L+C)/3 (standard). With Tick Replay every trade price is used. |
2. Bands
| Setting | Default | What it does |
|---|---|---|
| Band mode | VolumeWeightedStdDev | VolumeWeightedStdDev = sigma of the prices weighted by their volume since the reset. Percent = fixed % of the VWAP. |
| Band 1 | yes | |
| Band 1 multiplier | 1.0 | |
| Band 2 | yes | |
| Band 2 multiplier | 2.0 | |
| Band 3 | yes | |
| Band 3 multiplier | 3.0 |
3. Volume Data
| Setting | Default | What it does |
|---|---|---|
| Volume source | Auto | Auto = every trade from Tick Replay when it is enabled (exact) ; without it the chart bars rebuild the history and every live trade is added. TickSeries = hidden 1-tick series (exact without Tick Replay, heavier). ChartBars = the chart bars only. |
| Calculate on every tick (real time) | yes |
4. Display
| Setting | Default | What it does |
|---|---|---|
| Fill between the bands | yes | |
| Fill opacity (%) | 12 | |
| VWAP width | 2.5 | |
| Band width | 1.3 | |
| Price labels | yes | |
| Session start marker | yes | |
| Previous sessions | yes | |
| Header | yes | |
| Legend | yes | |
| Dashboard | no |
5. Alerts
| Setting | Default | What it does |
|---|---|---|
| Alert when price crosses the VWAP | no | |
| Alert when price reaches band 2 | no | |
| Sound file | Alert4.wav | File name from the NinjaTrader sounds folder (or a full path). Empty = silent. |
| Alert rearm (seconds) | 30 |
6. Trading Evolution
| Setting | Default | What it does |
|---|---|---|
| Show logo | yes | |
| Header opacity (%) | 90 | |
| Diagnostic mode (Output window) | no |
7 colours you can customise in NinjaTrader's Colours tab.
Installation in NinjaTrader 8
- Download the free pack (ZIP file) that contains the indicator from the Free indicators section of the home page.
- In NinjaTrader 8, open Tools › Import › NinjaScript Add-On, choose the ZIP file, then restart NinjaTrader.
- Activate your free license: Control Center › New › Trading Evolution License, then save your key.
- On a chart, open the indicator list (right-click › Indicators) and add “TEVO VWAP”.
Common problems and fixes
- The VWAP does not start at the expected open. Check SessionHours (RTH or ETH) and the RTH times; on a chart not set to New York time, adjust the time reference.
- The anchored VWAP does not show. Set ResetPeriod = Anchored and an anchor time inside the loaded data.
- The indicator is not in the list. Check that the pack import (Tools › Import › NinjaScript Add-On) finished without an error, then restart NinjaTrader. NinjaTrader compiles every script together: an error in another installed script can block the import, so fix or remove that script. If the tool shows a license message, save your free key in Control Center › New › Trading Evolution License.
- “Already contains a definition” error. An older copy of the same indicator exists under another file name: delete it, then compile again.
Limitations
- Without Tick Replay, history uses the bars’ typical price: close to, but not identical with, the trade-by-trade calculation.
- The bands measure past dispersion; they are not targets.
- On a market with unreliable volume (some forex sources), the VWAP loses its meaning.
- No level is guaranteed: futures trading involves a risk of losing capital.
Frequently asked questions
Is the indicator free?
Yes: the indicator is free (free pack and free license), with no subscription, and its source code is readable. It runs in NinjaTrader 8; the platform and market data have their own terms, which may involve fees.
Do I need to import a ZIP file?
Yes. The tool is part of the free Order Flow pack, a ZIP file: in NinjaTrader 8, open Tools › Import › NinjaScript Add-On, choose the ZIP, then restart NinjaTrader. Then activate your free license: Control Center › New › Trading Evolution License.
How are the bands calculated?
From the volume-weighted standard deviation of prices since the reset, multiplied by 1, 2 and 3. Percent mode replaces that deviation with a fixed percentage of the VWAP.
RTH or ETH?
RTH starts the VWAP at the New York regular-hours open (09:30 by default). ETH uses the chart’s full electronic session, overnight included.
How do I anchor the VWAP?
Set ResetPeriod = Anchored, then the anchor time (chart time). The VWAP starts from that point and is never reset.
Related concepts and tools
Other free NinjaTrader 8 indicators
Related articles
Educational content. These indicators are not investment advice and guarantee no result. Futures trading involves a risk of loss that can exceed the initial investment. Terms of use · Disclaimers