
Volume profile: where the market did business
A volume profile turns volume on its side: instead of showing how much traded in each bar, it shows how much traded at each price. It is a map of where buyers and sellers agreed, and a useful frame for the day’s decisions.
What a volume profile shows
A volume profile is a horizontal histogram drawn next to price. For a chosen period, it adds up all the contracts traded at each price and draws a bar proportional to that volume. Long bars show prices where a lot of business was done; short bars show prices the market passed through quickly.
The idea comes from reading the market as an auction. Price moves to find levels where both buyers and sellers are willing to trade; once it finds them, volume builds up. The profile makes that process visible. It has no time axis, so it tells you where volume traded, not when, and it is often paired with a footprint for the bar-by-bar detail.
Like other order flow tools, it needs real traded volume, which exchange-traded futures provide. Some profiles also split each price into volume at the bid and at the ask, which gives delta by price.
POC, value area, VAH and VAL
- POC (point of control): the price with the most volume in the profile.
- Value area: the range of prices around the POC that contains a set share of the total volume, commonly about 70%. The figure is a convention inherited from Market Profile, where it was chosen as a rough equivalent of one standard deviation; it is a setting, not a law.
- VAH (value area high) and VAL (value area low): the upper and lower edges of the value area.
A common method starts at the POC and adds the neighbouring price with the greater volume, above or below, until the target share is reached. Some platforms add two levels at a time or follow other rules, so VAH and VAL can differ by a tick or two from one tool to another.
An illustrative calculation
The table uses invented numbers on a fictional contract; it is not market data.
| Price | Volume | Role |
|---|---|---|
| 101.50 | 20 | — |
| 101.25 | 45 | — |
| 101.00 | 110 | VAH |
| 100.75 | 180 | POC |
| 100.50 | 150 | VAL |
| 100.25 | 60 | — |
| 100.00 | 35 | — |
70% of 600 is 420 contracts. Starting from the POC (180), the level below (150) is larger than the level above (110), so it is added first, making 330. Next, 110 above beats 60 below: 440, which passes 420. The value area therefore runs from 100.50 (VAL) to 101.00 (VAH) and holds about 73% of the volume. With a two-levels-at-a-time method, the result would be slightly wider.
High-volume and low-volume nodes
A profile is rarely a single smooth bell. It often shows several peaks and valleys:
- High-volume nodes (HVN) are prices where a lot of volume traded: the market accepted those prices for a while. When price returns to them, many traders expect it to slow down and rotate, because participants on both sides hold positions around that area.
- Low-volume nodes (LVN) are prices with little volume, often left behind by a fast move. The market spent little time there, so price can cross them quickly again, or react at their edge, since they separate two areas of acceptance.
These are tendencies traders watch for, not rules. The same node can hold one day and be crossed without a pause the next.
Session, composite and visible-range profiles
- Session profile: one profile per session or day. It shows how value developed during the day and gives the prior day’s POC, VAH and VAL, which many traders use as reference levels for the next session. On futures that trade nearly around the clock, decide whether the profile covers the full electronic session or only regular trading hours: the two give different levels.
- Composite profile: several sessions merged into one, for example a week or a multi-day range. It brings out the larger areas of balance and the levels that frame them.
- Visible-range profile: a profile of whatever is on screen. Convenient, but its levels change as soon as you scroll or zoom, which makes it a less stable reference.
- Fixed or anchored range: a profile drawn over a period you choose, such as a trend leg or the move since a news release.
The developing POC tracks where the current session’s POC sits as the day unfolds. When it migrates steadily in one direction, value is being built higher or lower; when it stays put, the market is balancing. Time windows matter here: the ICT Killzones & Daily Profiles indicator marks the New York sessions and killzones, which can help you decide which part of the day a profile should cover.
Using the profile for context: acceptance and rejection
Auction logic gives a simple frame. When the market is in balance, price rotates inside a value area, and its edges, VAH and VAL, are where so-called responsive traders often look to fade moves back toward the middle. When it shifts to imbalance, price leaves value to look for a new area where trade can take place.
Two situations come up again and again:
- Acceptance: price leaves the prior value area and stays out, with volume building at the new prices. Value is migrating, and the old VAH or VAL may serve as a reference on a retest.
- Rejection: price probes outside value but fails to build volume there and comes back quickly. The probe found no one willing to trade at those prices, and a rotation back through the value area is one possible outcome.
Where the session opens relative to the prior value area is also part of the picture: an open inside value leaves balance in play, an open outside value raises the question of acceptance or rejection. Neither case tells you which will happen. Combine the profile with time of day, a wider order flow reading and a defined risk before acting.
Profile shapes
Traders also describe profiles by their shape. A D-shaped profile is balanced, with volume in the middle and thin extremes. A P-shaped profile concentrates volume in its upper part after a rise, with a thin tail below; some traders associate it with short covering rather than fresh buying. A b-shaped profile is its mirror image, after a decline.
These labels summarise what has already happened. They help describe a session and compare it with others, but a shape does not tell you what the next session will do.
Limitations
- Choices change the levels. Session boundaries, value area percentage, calculation method and tick grouping all shift the POC, VAH and VAL.
- No time dimension. A profile does not show whether volume traded early or late, in one burst or evenly.
- Levels are not walls. HVNs, LVNs and value area edges are areas where traders often watch for a reaction, not prices where the market must turn.
- Data dependence. On spot forex, a profile relies on tick volume and does not show contracts traded; on futures, it depends on the quality of your feed.
- Risk. A level with a convincing profile story can still break. Define your stop and size your position from it; see the risk disclaimer.
The free tools for NinjaTrader 8
 Available
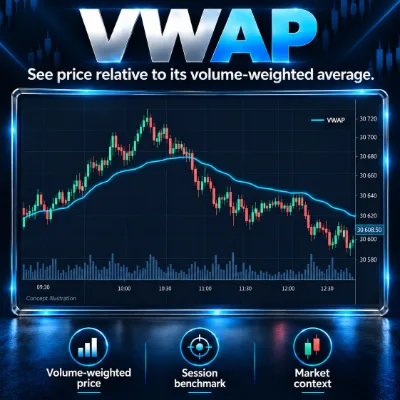
TEVO VWAP
TEVO VWAP, a free NinjaTrader 8 indicator: session, weekly, monthly or anchored VWAP with 3 volume-weighted standard deviation bands and alerts.
Documentation →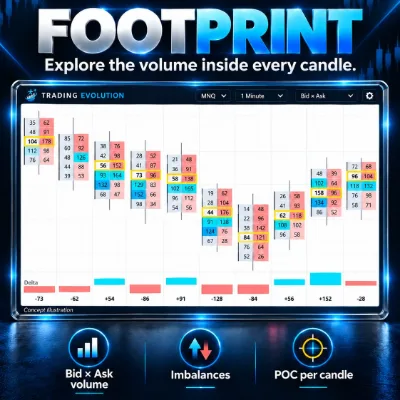 Available
TEVO Footprint
TEVO Footprint, a free footprint indicator for NinjaTrader 8: bid × ask volume per price, diagonal and stacked imbalances, bar POC and a delta table.
Documentation →Frequently asked questions
Why is the value area 70%?
It is a convention from Market Profile, chosen as a rough equivalent of one standard deviation. Most tools let you change it, and that choice changes the VAH and VAL.
Session or composite profile: which one should I use?
They answer different questions. The session profile describes one day and gives the prior day’s references; the composite shows the larger areas of balance over several days. Many traders look at both, starting with the bigger picture.
Is the POC a support or resistance level?
Not by definition. It is the price with the most volume over the period. Traders often watch how price behaves when it returns to a prior POC, but it can be crossed like any other price.
What is the difference between volume profile and Market Profile?
Market Profile, developed at the Chicago Board of Trade, builds the distribution from time: letters (TPOs) mark the prices traded during each period, usually 30 minutes. Volume profile builds it from traded volume. Both share concepts such as the POC and value area, but their levels can differ.
Related concepts and tools
More Order Flow guides
Related articles
Educational content. These indicators are not investment advice and guarantee no result. Futures trading involves a risk of loss that can exceed the initial investment. Terms of use · Disclaimers