Order Flow pack
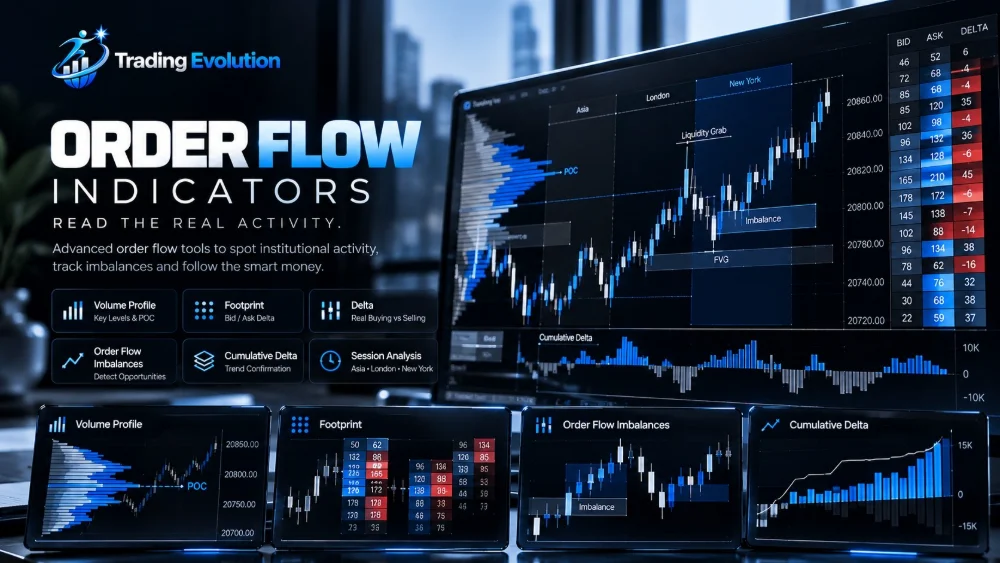
The order book, the bid × ask footprint, large prints, cumulative delta and VWAP: the 5 TEVO tools in a single file to import.
- TEVO DOM
- TEVO Footprint
- TEVO Big Trades
- TEVO Cumulative Delta
- TEVO VWAP
Algo models, backtesting dashboards, smart-money concepts and precision NinjaTrader 8 indicators.
Beginners welcome · No prior knowledge needed · Content in English
Two packs, one file each: the Order Flow tools to read the order book and volume, and the ICT / Smart Money models we teach. Import the pack into NinjaTrader, then activate your free license.

The order book, the bid × ask footprint, large prints, cumulative delta and VWAP: the 5 TEVO tools in a single file to import.

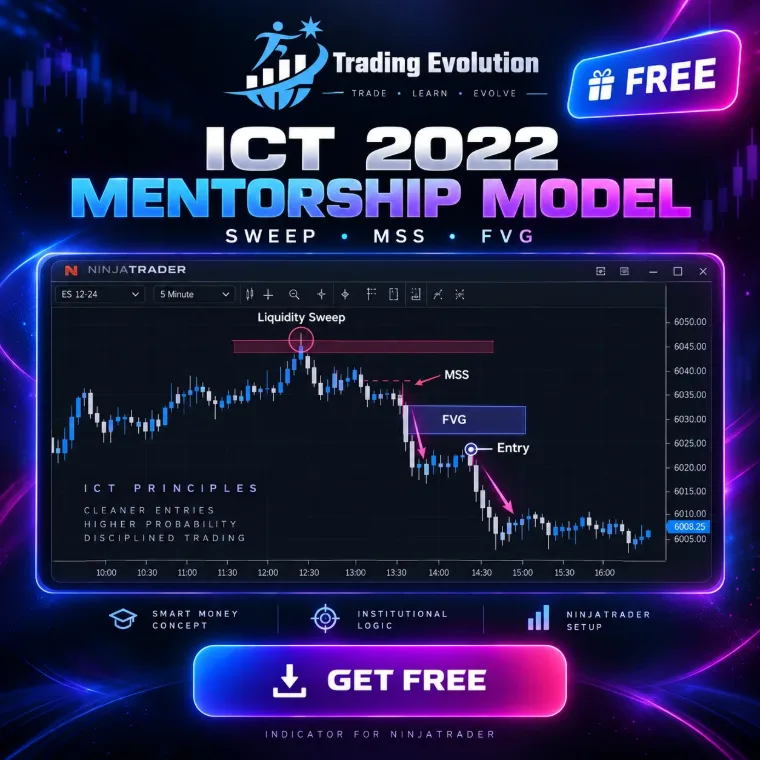
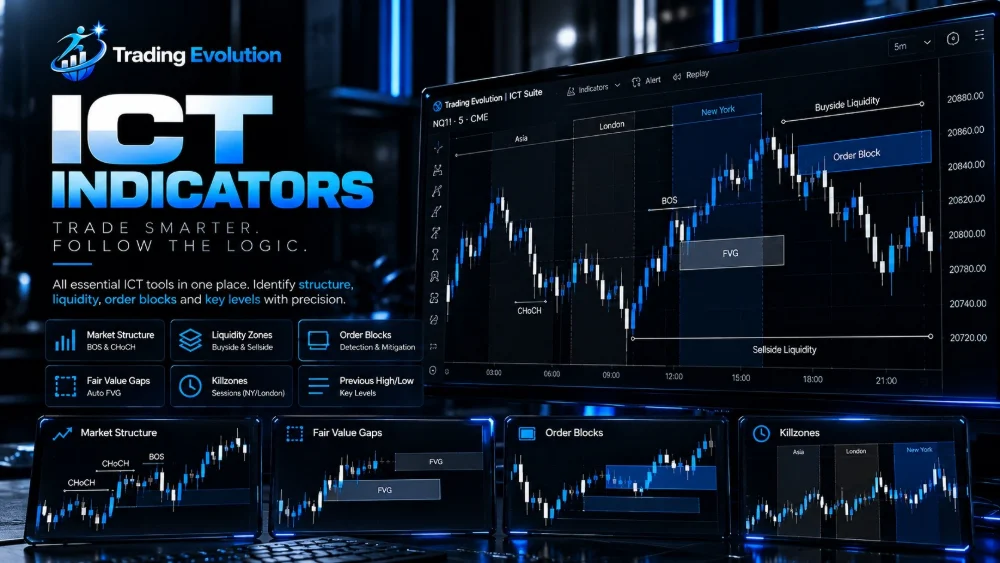
Structure, liquidity, FVG, order blocks, killzones and the ICT models we teach: the 10 indicators in a single file to import.
After the import: in NinjaTrader, Control Center > New > Trading Evolution License, then paste your key. It is free and waiting for you in your member area.
Get my free licenseIndicators for NinjaTrader 8, for educational use. They are not investment advice and guarantee no result.
The step-by-step guide, from choosing your indicator to adding it to your NinjaTrader 8 chart.
The DOM (Depth of Market) shows the resting limit orders at every price: buyers on the bid, sellers on the ask. You see where the liquidity sits before price gets there.
The depth bars measure the resting orders at each level. A big wall can slow price down, or vanish at the last moment.
One row per tick: the last price, the spread and the size Δ to see orders being added or pulled.
Every executed trade with its time, price and quantity: cyan at the ask (aggressive buy), red at the bid (aggressive sell).
Animated simulation for educational purposes, fictitious data. In NinjaTrader, TEVO DOM reads your Level 2 feed in real time.
A regular candle sums up four prices. The footprint opens it and shows, at every level, the volume sold on the bid and bought on the ask. You see who really pushed price.
Aggressive selling on the bid on the left, aggressive buying on the ask on the right, level by level.
When one side overwhelms the other (300% on the diagonal), the cell lights up: cyan for buyers, red for sellers.
The most traded price of each candle is boxed in yellow, and the candle's delta shows at the bottom.
Animated simulation for educational purposes, fictitious data. In NinjaTrader, TEVO Footprint is built trade by trade with Tick Replay.
Official Member of the NinjaTrader EcosystemWhat you learn in our modules and practice in the Order Flow Lab, you then read on futures with NinjaTrader, the award-winning platform of order flow traders.
Partner link. Futures trading involves a risk of capital loss.
Read market depth in real time and place your orders directly on the price ladder.
Applied in module 08 →Volume at the bid and at the ask at every price level: spot absorption, delta and the POC.
Applied in module 08 →Replay a past session to practice the method without committing your capital.
Ideal for modules 03 and 04 →Test your rules on historical data, then automate them: the extension of the quantitative module.
Applied in module 09 →Download it in a few minutes from the official NinjaTrader website.
Download NinjaTrader →Install NinjaTrader and practice in simulation before committing a single euro.
See the platform →Structure, zones, order flow: the Trading Evolution rules, on real markets.
Go to the course →
Keep Trading Evolution as your method and NinjaTrader as your trading workstation: it's the combination we use to read order flow on futures.
Get started with NinjaTraderTrading Evolution is a NinjaTrader partner: we may receive a commission if you open an account, at no extra cost to you. Disclaimers
Big players leave traces: trades far larger than average. TEVO Big Trades draws them as bubbles at their price and time, with an area matching the executed volume.
Only trades above your minimum size show up: 50 contracts by default, adjustable on the chart.
The area follows the volume: a 400-contract order jumps out next to a 50-lot.
Cyan = aggressive buy at the ask, red = aggressive sell at the bid. Hover a bubble to see the time, size and price.
Animated simulation for educational purposes, fictitious data. In NinjaTrader, TEVO Big Trades reads every trade in real time.
Four data points to track every month. The chart updates when you switch indicator.
Illustrative values for educational purposes. Live data in the calendar below.
Fed, ECB, BoE, BoJ. A rate hike draws capital into the currency. The tone of the statement matters as much as the number.
Rising inflation pushes the central bank to tighten. The market reacts to the gap between the published figure and expectations.
First Friday of the month. The most volatile report on the calendar: trade it after the reaction, never during it.
A PMI above 50 = expansion. GDP confirms the trend and steers rate expectations.
Live news, and our weekly analysis format: macro context, structure, trade plan.
Context: cautious ECB, dollar waiting on CPI. Plan: buy on a retest of the 1.0800 – 1.0820 zone, invalidation below the last HL.
Context: US yields pulling back. Technically, wave 3 in progress above the EMA 20. Target: 1.618 extension, stop below wave 2.
Context: tech earnings week. Equal highs swept, then a change of character. Looking to sell at the unfilled FVG.
Sample analysis formats for educational purposes. This is not investment advice.
Vocabulary, candles, market structure. You understand what you're looking at before you click.
Price action + ICT + moving averages, validated by the economic context. A checklist, not gut feeling.
Install the indicator, follow the zones and signals, log every trade and improve your consistency.
Every concept is drawn and animated. You see the pattern before you read about it.
We combine three approaches into one clear checklist. Fewer indicators, more discipline.
1% per trade, risk/reward ratio, journal. It's the foundation, we don't skip it.
Weekly analysis, live sessions, Q&A. You don't learn alone.
Create your account with Google to enter the app: indicator, this week's analysis, course and progress tracking.
Google verifies who you are. We only receive your name, email, avatar and Google account ID. Free account, no card required.
Free · Google account required · You can sign out at any time
MT5 file and TradingView script, with the installation guide and settings per market.
Get it on TelegramEUR/USD, XAU/USD, indices: macro context, structure and trade plan published every Sunday.
See the analysisLive sessions, Q&A and real-time indicator alerts on Telegram.
Tick off completed modules. Saved on this device.
0 / 8 modulesYes. Module 1 starts from scratch: what a pip, a lot, leverage and sessions are. You then move on to market structure and advanced concepts at your own pace.
Price action reads raw price (structure, candles, zones). Technical analysis adds calculated tools (EMA, SMA, RSI, waves). Fundamentals explain the why (rates, inflation, employment). The method combines all three.
The Trading Evolution indicator runs on MetaTrader 5 and TradingView, with an installation guide and recommended settings per market. The free ICT indicators are NinjaScript files for NinjaTrader 8.
Forex (majors and minors), gold and silver, US and European indices, oil and the main cryptos. The method applies wherever there is liquidity.
Trading Evolution is an Official Member of the NinjaTrader Ecosystem. It's the platform we use for the Order Flow module, because it gives access to the order book, the footprint and real volume on futures. Links to NinjaTrader are partner links: we may receive a commission if you open an account, at no extra cost to you. Details are in the disclaimers at the bottom of the page.
Yes. They are free NinjaScript (.cs) files, with no subscription, and you can read them before compiling. Every available indicator has its own documentation page: how it works, settings and installation. NinjaTrader 8 remains third-party software with its own terms.
No. Trading Evolution is educational content. Margin trading carries a high risk of capital loss. Never trade with money you need.
Join the course, get the indicator and follow the analysis every week.
A real Google account is required: no password to create, no card. We only receive your name, email, avatar and Google account ID.
Sign-in secured by Google
By continuing, you accept our terms of use and our privacy policy.
These indicators run on the NinjaTrader platform. Click the button, create your NinjaTrader account in the new tab, install the platform and log in: this unlocks the download and indicator activation.
Watch the setup video tutorial Download NinjaTrader Partner link · DisclaimersThe download unlocks when you come back here after creating your NinjaTrader account.
Download the fileThe file for this indicator is coming to this page very soon.
Installation: put the file in Documents\NinjaTrader 8\bin\Custom\Indicators, then compile in the NinjaScript editor (F5).If you didn’t open a new NinjaTrader account with our link in step 1, your indicators will be disabled in 3 days.