
TEVO Footprint: a bid × ask footprint for NinjaTrader 8
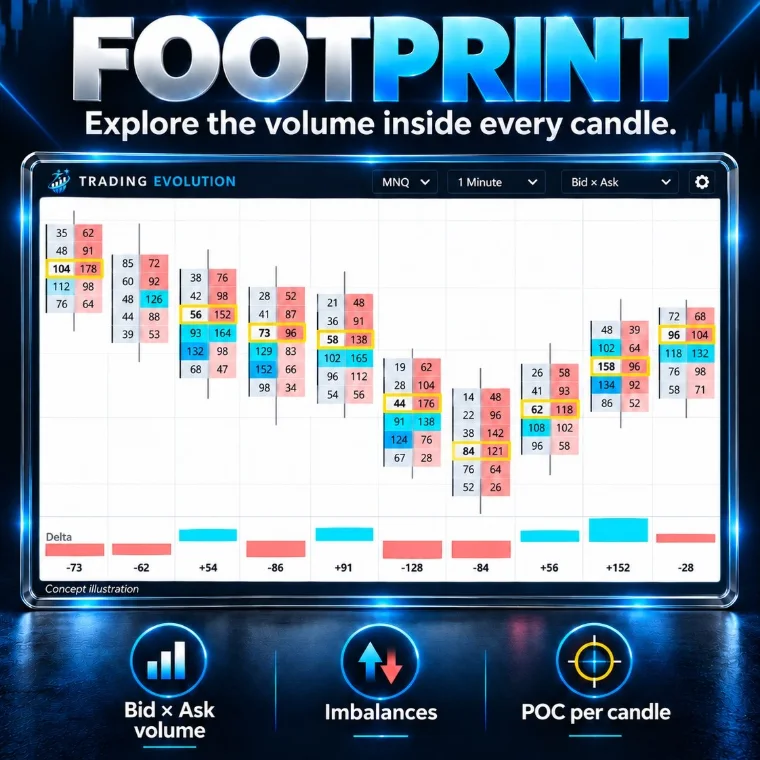
TEVO Footprint replaces each candle with its volume cells: at every price, the volume sold at the bid on the left and bought at the ask on the right. It flags diagonal and stacked imbalances, boxes each bar’s POC and shows a delta table under the chart.
The download takes two steps, from the “Free indicators” section of the home page.
- Platform
- NinjaTrader 8
- File
- NinjaScript (.cs), readable source code
- Calculation
- On every tick (real time)
- Price
- Free
- File updated on
- 8 October 2026
What the indicator does
- Bid × ask cells. For each bar and price row: volume sold aggressively at the bid × volume bought aggressively at the ask (BidAsk content by default, or Delta, or Volume). Row height adapts (about 12 rows per bar in auto); cells are shaded by volume.
- Diagonal imbalances. A row’s ask is compared with the bid one row lower (and vice versa): one side must exceed the other by 300% and by at least 10 contracts. Horizontal mode available.
- Stacked imbalances. Three or more consecutive imbalances form a zone, extended to the right until price trades back into it (optional alert).
- POC and candle. Each bar’s most traded price is boxed; a small candle beside the cells keeps the OHLC reading, and the native bars are hidden.
- Delta and table. Delta under each bar, and a table at the bottom: time, volume, delta, delta %, cumulative delta (reset every session).
Data and markets
- Futures and any instrument whose trades come with the bid and ask: that is what classifies each trade as a buy or a sell.
- Short timeframes (1 to 5 minutes, tick or range charts): bars need enough spacing to read the numbers (right-click › Properties, or Ctrl + mouse wheel on the time axis).
- Calculated on every tick in real time; 3,000 bars kept in memory by default.
Requirements: what is free and what may cost money
- NinjaTrader 8, a desktop platform for Windows. The indicator is free; NinjaTrader is third-party software with its own terms, and it may cost money depending on how you use it (licence, live trading).
- Market data. Prices, volume and market depth come from your connection (broker or data provider). Depending on the exchange and the subscription, this data may be billed: check your provider’s terms.
- Exact history with Tick Replay. Enable “Show Tick Replay” in Tools › Options › Market Data, then tick Tick Replay in the chart’s Data Series window. Your provider must supply tick history with the bid and ask; the chart then loads more slowly.
- Without Tick Replay. Volume source = TickSeries loads a hidden 1-tick series: history is available, but trades are classified by up / down tick, which is less precise than the bid / ask.
Reading example (educational)
A bullish bar shows ask cells at its high far stronger than the bid one row lower (cyan imbalances), then the next bar finds no more buyers at that price: weak ask cells, negative delta. That shift from aggression to exhaustion shows in the cells; it remains context to confirm with price structure.
Settings
Each setting is named exactly as NinjaTrader shows it, with its default value read directly from the source code (.cs).
1. Footprint
| Setting | Default | What it does |
|---|---|---|
| Cell content | BidAsk | BidAsk = volume sold at the bid x volume bought at the ask. Delta = ask - bid of the row. Volume = total of the row. |
| Ticks per row (0 = auto) | 0 | 0 = about 12 rows on a typical bar of the chart. |
| Imbalance ratio (%) | 300 | 300 = one side traded at least 3 times the other (usual footprint setting ; NinjaTrader volumetric default 150). |
| Minimum difference for an imbalance | 10 | The two compared volumes must also differ by at least this many contracts (NinjaTrader default 10). |
| Imbalance comparison | Diagonal | Diagonal = ask of a row vs bid one row lower, bid vs ask one row higher (the liquidity the aggressor consumed). Horizontal = same row. |
| Stacked imbalance (rows) | 3 | Consecutive imbalances needed for a stacked imbalance. |
| Extend stacked imbalances | yes | Zones drawn to the right until price trades back into them. |
| Show bar POC | yes | |
| Shade cells by volume | yes |
2. Delta
| Setting | Default | What it does |
|---|---|---|
| Delta type | BidAsk | BidAsk = trades at the ask are buys, at the bid sells (needs the bid / ask of each trade : Tick Replay or live). UpDownTick = up ticks vs down ticks. |
| Delta under each bar | yes | |
| Cumulative delta reset | Session |
3. Table
| Setting | Default | What it does |
|---|---|---|
| Show table | yes | |
| Time row | yes | |
| Volume row | yes | |
| Delta row | yes | |
| Delta % row | yes | |
| Cumulative delta row | yes |
4. Layout
| Setting | Default | What it does |
|---|---|---|
| Show candle beside the cells | yes | |
| Hide native bars | yes | |
| Column width (% of bar spacing) | 88 | Widen the bar spacing of the chart (right click > Properties, or Ctrl + mouse wheel on the time axis) to read the numbers. |
| Numbers from row height (px) | 11 | Rows thinner than this show only their shading. |
| Labels | yes | |
| Header | yes | |
| Legend | yes |
5. Data
| Setting | Default | What it does |
|---|---|---|
| Volume source | Auto | Auto = Tick Replay when it is enabled on the chart, otherwise a hidden 1-tick series builds the history ; live trades come with their bid / ask. TickSeries = hidden 1-tick series for the history and the live trades. |
| Calculate on every tick (real time) | yes | |
| Bars kept in memory | 3000 |
7. Alerts
| Setting | Default | What it does |
|---|---|---|
| Alert on a new stacked imbalance | no | |
| Sound file | Alert4.wav | File name from the NinjaTrader sounds folder (or a full path). Empty = silent. |
| Alert rearm (seconds) | 30 |
8. Trading Evolution
| Setting | Default | What it does |
|---|---|---|
| Show logo | yes | |
| Diagnostic mode (Output window) | no |
8 colours you can customise in NinjaTrader's Colours tab.
Installation in NinjaTrader 8
- Download the free pack (ZIP file) that contains the indicator from the Free indicators section of the home page.
- In NinjaTrader 8, open Tools › Import › NinjaScript Add-On, choose the ZIP file, then restart NinjaTrader.
- Activate your free license: Control Center › New › Trading Evolution License, then save your key.
- On a chart, open the indicator list (right-click › Indicators) and add “TEVO Footprint”.
Common problems and fixes
- The numbers do not show. Rows are too thin: widen the bar spacing or reduce the number of rows (Ticks per row). Under 11 px only the shading remains.
- The history is empty or approximate. Enable Tick Replay (see requirements), or set Volume source = TickSeries.
- The indicator is not in the list. Check that the pack import (Tools › Import › NinjaScript Add-On) finished without an error, then restart NinjaTrader. NinjaTrader compiles every script together: an error in another installed script can block the import, so fix or remove that script. If the tool shows a license message, save your free key in Control Center › New › Trading Evolution License.
- “Already contains a definition” error. An older copy of the same indicator exists under another file name: delete it, then compile again.
Limitations
- Without bid / ask per trade (history without Tick Replay), buy / sell classification is approximated with the tick rule.
- The 300% threshold and the 10-contract minimum are setting choices, not universal rules: adapt them to the market.
- Many bars and rows use memory: keep a reasonable history.
- An imbalance is not a guaranteed signal: futures trading involves a risk of losing capital.
Frequently asked questions
Is the indicator free?
Yes: the indicator is free (free pack and free license), with no subscription, and its source code is readable. It runs in NinjaTrader 8; the platform and market data have their own terms, which may involve fees.
Do I need to import a ZIP file?
Yes. The tool is part of the free Order Flow pack, a ZIP file: in NinjaTrader 8, open Tools › Import › NinjaScript Add-On, choose the ZIP, then restart NinjaTrader. Then activate your free license: Control Center › New › Trading Evolution License.
Do I need Tick Replay?
For an exact history, yes: every past trade then comes with its bid and ask. In real time, live trades are enough. Without Tick Replay, the TickSeries option gives an approximate history.
What is a diagonal imbalance?
Comparing the ask at one price with the bid one price lower (the liquidity the aggressive buyer consumed), and vice versa. Here one side must exceed the other by 300% and by at least 10 contracts.
How is it different from NinjaTrader’s footprint?
NinjaTrader’s volumetric bars are part of the platform’s Order Flow+ offer. TEVO Footprint is a free NinjaScript indicator drawn on a regular chart, with its own delta table.
Related concepts and tools
Other free NinjaTrader 8 indicators
Related articles
Educational content. These indicators are not investment advice and guarantee no result. Futures trading involves a risk of loss that can exceed the initial investment. Terms of use · Disclaimers