
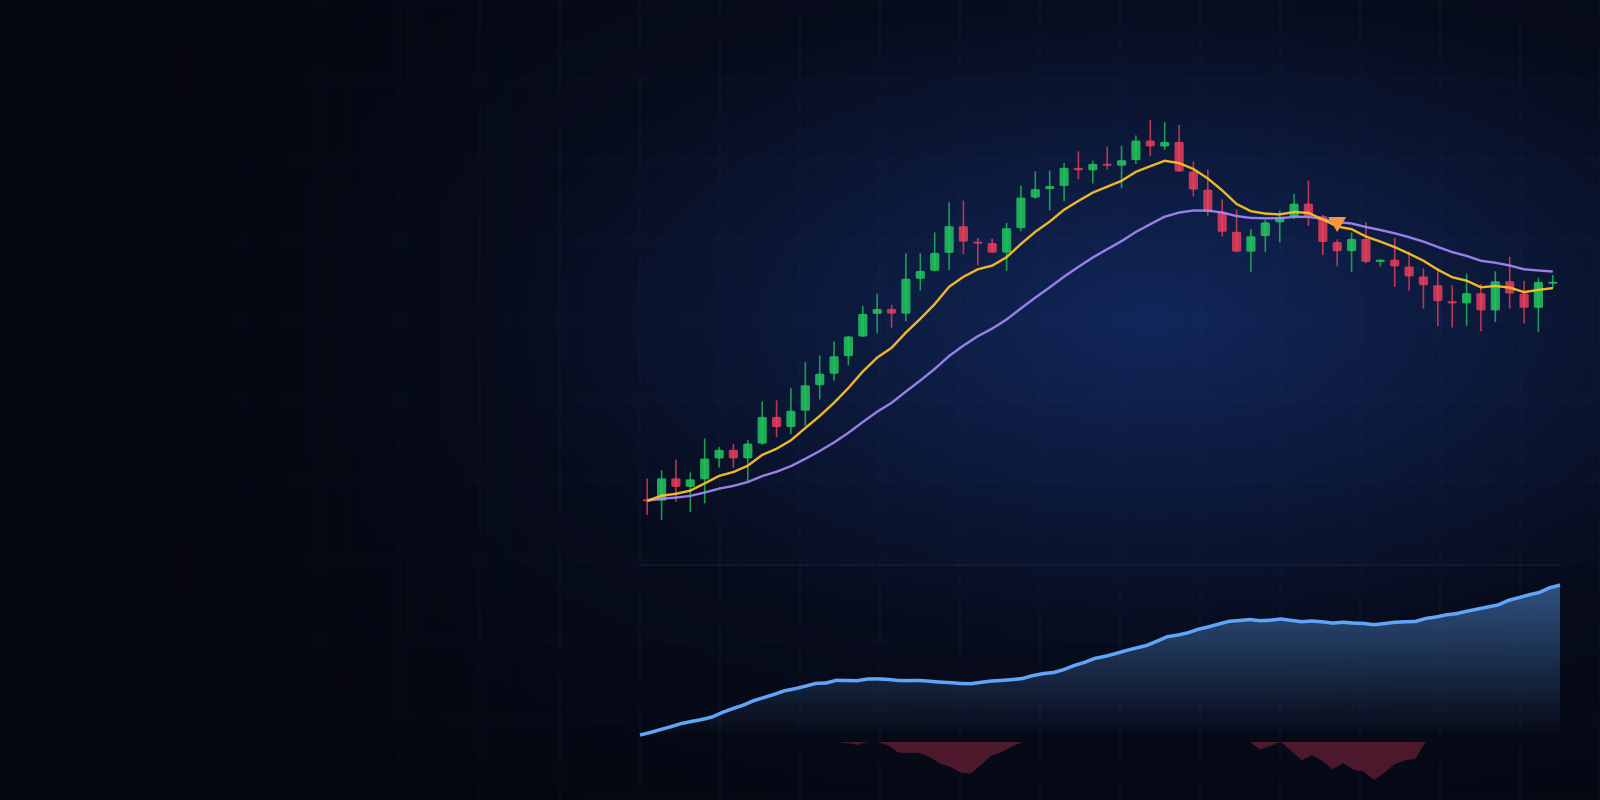
Backtesting: test your trading strategy before you risk real money
Build a strategy from 20+ indicators or start from a proven template, run it on years of official market data or on your own NinjaTrader export, and see every trade, the equity curve, the drawdown and 30 statistics in seconds.
- 9Strategy templatesEMA cross, RSI, Bollinger, Turtle breakout, MACD, ICT liquidity sweep…
- 20+Indicators & conditionsCrosses above / below, all-or-any logic, mirrored short side.
- NT8Your NinjaTrader dataDrop an export: it stays on your device.
- ▶Manual replayTrade bar by bar with the future hidden.
Backtest a trading strategy now
Pick a market and a template, adjust the rules, then press Run. Every calculation happens in your browser: no account, no upload, no limit on the number of backtests.
Loading the backtester…
How to backtest a trading strategy in 4 steps
- Choose your dataA market from the library (official daily prices since 1971 for forex, since 1986 for oil) or your own file exported from NinjaTrader, TradingView or MetaTrader, down to 1-minute bars.
- Write the rulesStart from a template or add conditions: “EMA (20) crosses above EMA (50)”, “RSI (14) is below 30”, “Close crosses above Donchian high (20)”. Combine them with All or Any.
- Set exits and costsStop loss, take profit (in %, ATR, points or R), trailing stop, time exit, session filter, position size, commission and slippage.
- Read the resultsNet profit, CAGR, max drawdown, profit factor, win rate, Sharpe ratio, every trade on the chart, monthly returns and a comparison with buy & hold.
9 strategy templates to start from
Each template is a starting point, not a recommendation. Change any rule and press Run again to see the effect.
- EMA crossover 20/50. Trend following: long when the 20 EMA crosses above the 50 EMA, short on the opposite cross.
- Golden cross 50/200. The classic long-term signal: the 50-day average crossing the 200-day average.
- RSI reversal 30/70. Mean reversion: buy when RSI(14) climbs back above 30, exit above 70. Stop at 2 × ATR.
- Bollinger Bands mean reversion. Buy a close back inside the lower band, exit at the middle band. Stop at 2 × ATR.
- Donchian breakout (Turtle 20/10). The Turtle rules: enter on a 20-bar breakout, exit on a 10-bar breakout the other way. Stop at 2 × ATR.
- MACD momentum + 200 EMA. MACD crossing its signal line, only in the direction of the 200 EMA.
- ADX trend pullback. Trend pullback: 20 EMA above 50 EMA, ADX above 25, entry when price crosses back above the 20 EMA.
- Previous-day liquidity sweep (ICT). ICT-style raid: price sweeps the previous day's low and closes back above it. Stop 1.5 × ATR, target 2R, out after 20 bars.
- Custom strategy. Build your own rules: every condition is an indicator, an operator and another indicator or a value.
How to read backtest results
Net profit and CAGR
What the strategy earned after costs, and the same result as a yearly growth rate. Always compare it with buy & hold on the same market and period.
Max drawdown
The largest fall of the equity curve from a peak, in %. It is the pain you would have lived through. A strategy that earns 20% a year with a 50% drawdown is very hard to follow in real time.
Profit factor
Gross profit ÷ gross loss. Above 1 the strategy made money; most robust systems sit between 1.3 and 2. A value above 3 on few trades usually means overfitting.
Win rate and payoff
The share of winning trades and the average win ÷ average loss. A 35% win rate can be excellent with a payoff of 3; a 90% win rate can lose money if the losses are large.
Sharpe and Sortino ratios
Return per unit of volatility, annualised. Sortino only counts downside volatility. Above 1 is good for a single strategy; above 2 on a long test deserves a second look for errors.
Expectancy in R
The average result per trade as a multiple of the initial risk (needs a stop loss). +0.3R means each trade earns 30% of what it risks on average.
Backtest with your NinjaTrader data, step by step
NinjaTrader 8 can export any historical data saved on your computer to a text file. The backtester reads that file directly, converts the times and recognises the contract.
- In the NinjaTrader 8 Control Center, open Tools → Historical Data.
- In the Export section, choose the instrument (for example NQ 12-26), the interval Minute (or Day, or Tick) and the data type Last.
- Set the start and end dates, click Export and save the .txt file.
- Drop the file in “Your data file” above. NinjaTrader exports in UTC with end-of-bar times: the backtester switches the bars to their open time and converts them to New York time by default.
- The contract is read from the file name (NQ, ES, CL, GC…): the point value is filled in from the exchange's contract size. Pick a larger timeframe if you want (5 min, 15 min, 1 h…).
TradingView (Export chart data) and MetaTrader 5 (Symbols → Bars → Export Bars) files work the same way, as does any CSV with date, open, high, low, close columns.
Only data you are allowed to use goes in your file; it never leaves your device.
Backtesting mistakes that make bad strategies look good
- Overfitting. Tuning ten parameters until the curve looks perfect fits the past noise. Keep rules simple and test the same settings on other markets and periods.
- Look-ahead bias. Using information you could not have had at the time. Here a signal is read at the close of a bar and filled at the next open, so the future never leaks into a trade.
- Ignoring costs. Commissions and slippage eat scalping strategies alive. Set them before you trust a result.
- Too few trades. Twenty trades prove nothing. Aim for at least 100 before drawing conclusions.
- One market regime. A trend system tested only on a trending decade will fail in a range. Test bull, bear and sideways periods.
- No out-of-sample test. Build the strategy on one period (for example 2010–2019), then run it unchanged on the next (2020 onwards).
How this backtester simulates your orders
- Signals are evaluated at the close of each bar and filled at the open of the next bar (or at the signal bar's close if you choose it).
- Stops and targets are checked inside each bar with its high and low. When one bar touches both, the stop is counted first (the conservative choice). A gap through the stop fills at the open.
- The trailing stop moves at the close of each bar and applies from the next one. With both directions on, an opposite signal reverses the position at the same price.
- Daily library series contain closing prices only: orders and stops use the close.
- Indicators use all the history available before your start date, so the first trades are not distorted by warm-up periods.
- Results are hypothetical. They do not include financing costs, partial fills or liquidity limits.
From backtest to live trading in NinjaTrader
A good backtest is a filter, not a guarantee. The next step is a forward test: run the same rules in NinjaTrader on a simulation account for a few weeks and compare. Our free NinjaTrader 8 indicators mark the same setups on a live chart — the Turtle Soup and Power of 3 for liquidity raids, and the VWAP and footprint for order flow — and the position size calculator turns your stop into the right number of contracts. Check the economic calendar before each session: news days behave differently from the average day in a backtest.
Trade your strategy on NinjaTrader
Open your NinjaTrader account with our link to download futures historical data, export it here and forward-test your strategy in simulation before going live.
Open my NinjaTrader accountFree NinjaTrader indicators
Partner link. Futures trading involves a substantial risk of loss. Disclaimers
Good to know
- Past performance does not predict future results: a backtest shows what a set of rules would have done, not what it will do.
- Library markets are daily closing prices; for intraday strategies, use your own data file.
- Forex series are the Federal Reserve's noon buying rates in New York, not exchange settlement prices.
- Information and education only, not investment advice. Trading involves a substantial risk of loss.
Related concepts and tools
Frequently asked questions
What is backtesting in trading?
Backtesting means running a set of trading rules on historical prices to see how they would have performed: number of trades, profit, drawdown and risk. It tells you whether an idea is worth testing further before you put real money on it.
Is this backtester really free?
Yes. There is no account, no subscription and no limit on the number of backtests. The calculations run in your own browser.
Can I backtest with NinjaTrader data?
Yes. Export the data from NinjaTrader 8 (Tools → Historical Data → Export, as a .txt file) and drop the file in the backtester. Minute, daily and tick exports are supported; ticks are grouped into 1-minute bars.
Is my data uploaded anywhere?
No. Your file is read by your browser and the backtest runs on your device. Only the public market library is downloaded from Trading Evolution.
How accurate is a backtest?
It is only as good as its data and assumptions. This backtester fills orders at the next bar open, counts the stop first when a bar touches both stop and target, and includes commission and slippage, but it cannot model liquidity, partial fills or news spikes perfectly.
What is a good profit factor?
Above 1 the strategy made money. Most robust strategies show a profit factor between 1.3 and 2 over hundreds of trades. Very high values on a few trades usually mean the rules are overfitted.
What is a good maximum drawdown?
It depends on your tolerance, but many traders aim for a maximum drawdown below 20–25%. Compare it with the drawdown of buy & hold on the same market: a strategy should earn its risk.
How many trades do I need for a reliable backtest?
At least 100 trades, and ideally several hundred across different market conditions. Fewer trades make every statistic fragile.
What is the difference between backtesting and forward testing?
A backtest uses past data. A forward test (or paper trading) runs the same rules in real time on a simulation account, which shows how the strategy behaves with live prices, spreads and your own execution.
Can I backtest intraday and scalping strategies?
Yes, with your own minute or tick data. Use the session filter to trade only during market hours, close trades at the end of the session, and set realistic commission and slippage: costs matter most on short timeframes.
Hypothetical results: a backtest is calculated with the benefit of hindsight and does not reflect real trading, costs or liquidity. Trading Evolution is not affiliated with NinjaTrader, TradingView, MetaQuotes, the Federal Reserve or the EIA. Information only, not investment advice.
Related articles
Educational content. These indicators are not investment advice and guarantee no result. Futures trading involves a risk of loss that can exceed the initial investment. Terms of use · Disclaimers