
The footprint chart: reading the volume inside each bar
A candle shows four prices. A footprint shows what traded between them: how many contracts changed hands at each price, and whether buyers or sellers were the aggressors. Here is how to read one without making it say more than it does.
What a footprint shows
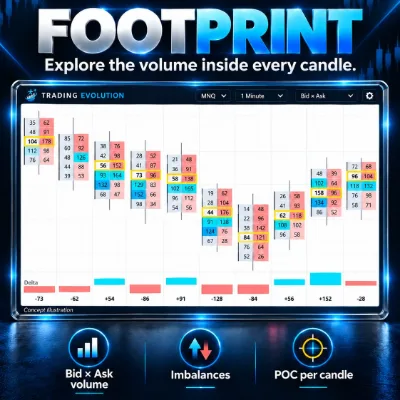
A footprint chart (also called a cluster chart, and Volumetric Bars on NinjaTrader 8) splits each bar into its price levels. At every price it shows two numbers: the volume traded at the bid, where sellers hit resting buy orders, and the volume traded at the ask, where buyers lifted resting sell orders.
The bar itself can be time-based (one minute, five minutes), tick-based, volume-based or range-based. The footprint does not change the bar type; it only opens it up. Levels can be shown tick by tick or grouped (for example two or four ticks per row) to stay readable on fast instruments.
Because every number depends on identifying the aggressor of each trade, a footprint is only as good as its data: it needs tick data with bid/ask information, in real time and, for past bars, from historical tick data.
Common display modes
Most footprint tools offer several ways to show the same data:
- Bid × Ask. Two columns per bar: volume at the bid on the left, volume at the ask on the right. This is the mode you need to spot diagonal imbalances.
- Delta. One number per price: ask volume minus bid volume. Positive means aggressive buyers dominated at that price; negative means aggressive sellers did.
- Volume. Total volume per price, often shaded like a small volume profile inside the bar.
Many traders add a summary below each bar: total volume, bar delta and sometimes the minimum and maximum delta reached while the bar was forming. Colours and shading are settings; learn what yours mean before drawing conclusions from them.
An illustrative footprint bar
The table below is an illustrative example, with invented numbers on a fictional contract that moves in steps of 0.25. It is not market data; it only serves to show the calculations.
| Price | Volume at bid | Volume at ask | Delta at price | Total |
|---|---|---|---|---|
| 101.00 | 12 | 3 | −9 | 15 |
| 100.75 | 40 | 58 | +18 | 98 |
| 100.50 | 22 | 95 | +73 | 117 (POC) |
| 100.25 | 30 | 41 | +11 | 71 |
| 100.00 | 18 | 6 | −12 | 24 |
Reading it: the bar traded 325 contracts, 203 at the ask and 122 at the bid, so the bar delta is +81. The POC of the bar, the price with the most volume, is 100.50. At the very top, only 3 contracts traded at the ask at 101.00: buyers did not insist at that price during this bar. The next sections explain how to read the diagonal between the 95 contracts at the ask at 100.50 and the 30 at the bid at 100.25.
Bar delta and the POC of each bar
Bar delta adds up the delta of every price in the bar. A clearly positive delta on a down bar, or a clearly negative delta on an up bar, shows that aggression and price did not go the same way during that bar, often because passive orders absorbed the aggressive side. The cumulative delta guide explains how these deltas add up over a session.
The POC of each bar shows where its volume was concentrated. Its position is telling: a POC near the high of an up bar means a lot of business was done right at the top; a POC near the low of an up bar means most of the volume traded before price moved away from it. Some traders watch whether later bars come back to these prices. None of this has a fixed meaning; it depends on where the bar forms and what happens next.
Diagonal imbalances and stacked imbalances
The obvious comparison would be bid and ask at the same price, but it is misleading. When the best bid is 100.25 and the best ask is 100.50, aggressive sellers trade at 100.25 and aggressive buyers at 100.50 at the same moment. Footprint tools therefore compare prices diagonally:
- Buy imbalance: volume at the ask at one price, compared with volume at the bid one tick lower.
- Sell imbalance: volume at the bid at one price, compared with volume at the ask one tick higher.
An imbalance is flagged when one side exceeds the other by a ratio you choose, for example 300% (three times as much). That threshold is a setting, not a rule: the values people use vary, and a lower ratio flags more levels. Many tools also let you ignore comparisons where volume is too small to matter. In the example bar, 95 at the ask at 100.50 against 30 at the bid at 100.25 gives a ratio of about 3.2, so it is a buy imbalance at a 300% threshold. The 40 at the bid at 100.75 against 3 at the ask at 101.00 also exceeds 300%, but with such a small number a minimum volume filter would probably discard the comparison.
Stacked imbalances are several consecutive prices, often three or more (again a setting), with imbalances on the same side. They mark a zone where one side was repeatedly aggressive as price moved through it. Many traders treat such zones as areas to watch if price returns: if they hold, the aggressive side may still be there; if price trades straight through them, the reading was wrong.
Absorption, exhaustion and thin prints
Absorption appears when heavy aggressive volume runs into a passive wall. On a footprint, it may look like large bid volume at the low of a bar while that low holds, or large ask volume at the high while price fails to go higher. The aggressive side is making the effort; someone with limit orders is taking the other side. Absorption becomes interesting when it happens at a level you had already identified, and it is only confirmed if price then moves away from it.
Exhaustion is the opposite picture: at the extreme of a move, aggressive volume dries up. A high printed with very little volume at the ask (like the 3 contracts at 101.00 in the example) suggests buyers stopped lifting offers at that price. Some traders also check whether the extreme has volume on both sides, which they call an unfinished auction likely to be revisited; that is a heuristic, not a law.
Thin prints are prices inside a bar where almost nothing traded because price moved through them very quickly. They show where the market did not spend time and, like the low-volume areas of a volume profile, they can be crossed quickly again if price comes back, with no guarantee that it will.
Reading the footprint in context
Read in isolation, a footprint invites overtrading: every bar contains an imbalance or a big number somewhere. The readings above matter mostly at prices that already matter in your plan: prior day high or low, session range, value area edges, or a level from your ICT analysis such as a fair value gap marked by the ICT 2022 Mentorship Model indicator.
A practical sequence: mark your levels before the session, wait for price to reach one, read the footprint for absorption, exhaustion or fresh imbalances in the direction you expect, and define your invalidation before entering. The footprint helps you judge behaviour at a location; it is not a reason to be in the market. The order flow guide shows how this fits into a complete plan.
Limitations
- Settings change the picture. Bar type, tick grouping, imbalance ratio and volume filters all change what gets highlighted. Two traders can look at the same session and see different footprints.
- Data dependence. Bid/ask classification and historical tick data vary between feeds. A historical footprint built without complete tick data may not match what was shown in real time.
- Hidden liquidity. Icebergs and cancellations do not appear in executed volume, and the footprint only shows trades in the contract you are watching.
- No predictive value on its own. Imbalances, absorption and exhaustion describe the past. They can fail, and trading them without a stop and a size defined in advance is a fast way to lose money.
The free tools for NinjaTrader 8
 Available
TEVO Footprint
TEVO Footprint, a free footprint indicator for NinjaTrader 8: bid × ask volume per price, diagonal and stacked imbalances, bar POC and a delta table.
Documentation →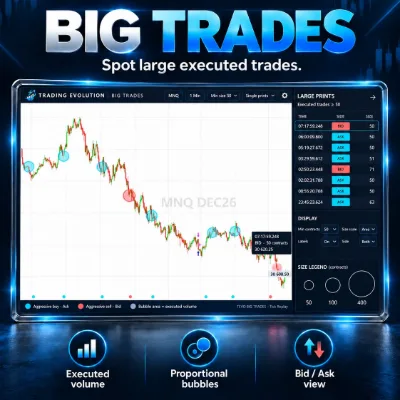 Available
TEVO Big Trades
TEVO Big Trades, a free NinjaTrader 8 indicator: large executed trades as bubbles sized by volume, at the bid or at the ask, at their price and time.
Documentation →Frequently asked questions
What is the difference between a footprint and a volume profile?
A footprint shows volume at the bid and at the ask at each price, bar by bar. A volume profile adds up volume at each price over a longer period, usually without a time dimension. The footprint is the close-up; the profile is the map.
What imbalance ratio should I use?
There is no correct value. 300% is a common starting point, but the ratio is a setting to adapt to the instrument and its usual volume. A higher ratio flags fewer, more extreme levels; a minimum volume filter avoids flagging comparisons between very small numbers.
Does a footprint work on any instrument?
It needs real traded volume with bid/ask information, which exchange-traded futures provide. On spot forex, platforms only have tick volume, so a footprint built on it would not show actual contracts traded.
Are Volumetric Bars a footprint?
Volumetric Bars is the name of NinjaTrader 8’s footprint-style bar type, part of its Order Flow+ tools. Check NinjaTrader’s official documentation for its options and for which license includes it.
Related concepts and tools
More Order Flow guides
Related articles
Educational content. These indicators are not investment advice and guarantee no result. Futures trading involves a risk of loss that can exceed the initial investment. Terms of use · Disclaimers