
Cumulative delta: measuring aggressive buying and selling
Delta counts which side crossed the spread. Added up over a session, it becomes cumulative delta, one of the most quoted and most misread order flow tools. Here is what it measures, how it is built and why a divergence is not a signal.
Delta per bar
For each trade, the software decides whether the aggressor was a buyer (the trade printed at the ask) or a seller (it printed at the bid). The delta of a bar is then simple:
delta = volume traded at the ask − volume traded at the bid, in other words aggressive buying minus aggressive selling.
A bar with 600 contracts at the ask and 450 at the bid has a delta of +150 (illustrative numbers). Delta says nothing about the total number of buyers and sellers: every trade has both a buyer and a seller, so total buying always equals total selling. Delta only measures who was in a hurry, the side that accepted the other side’s price.
On a footprint chart, you can see the delta of each price inside the bar, and the delta of the whole bar in the summary row.
Cumulative delta and resets
Cumulative delta is the running total of bar deltas from a starting point. If the first three bars of the session have deltas of +150, −80 and +40, cumulative delta reads +150, +70 and then +110 (illustrative numbers again). It is usually drawn in a separate panel, either as a line or as candles whose open, high, low and close track the running total during each bar.
The starting point matters. Most tools let you reset cumulative delta at the start of each session or day, or let it run over a longer period; some also let you anchor it at a chosen time. Resetting every session makes the value comparable from one day to the next and removes the drift of an ever-growing total. On futures that trade nearly around the clock, check whether the reset follows the full electronic session or only regular trading hours: the same bar can show a very different cumulative value depending on that choice.
The absolute number is rarely useful on its own. Traders look at its direction and slope compared with price, and at how it behaves around the levels in their plan.
What agreement and disagreement tell you
When price rises and cumulative delta rises with it, aggressive buyers are lifting offers and the market is moving their way: aggression and price agree. The same applies to falling prices with falling delta.
The interesting cases are the others:
- Price up, delta flat or falling. The rise is happening without net aggressive buying. Sellers may be pulling their offers, or passive buyers with limit orders may be doing the work while aggressive sellers hit their bids.
- Price down, delta flat or rising. The mirror case: aggressive buying is being absorbed by passive sellers, or bids are being withdrawn.
- Strong delta, no price progress. A lot of aggression going nowhere is the classic picture of absorption at a level.
Each of these describes the current auction; none of them is a forecast.
Divergences: why they are not signals on their own
A delta divergence is usually defined like this: price makes a higher high while cumulative delta makes a lower high, or price makes a lower low while cumulative delta makes a higher low. The idea is that the new extreme was reached with less aggressive participation than the previous one.
The problem is that divergences are common and can last. Price can keep climbing with falling delta for a long time if passive buyers keep absorbing the selling, or if offers keep being pulled. A divergence has no built-in timing either: it says the extreme was reached with less aggression, not when, or even whether, the move will reverse.
Traders who use divergences generally ask for more: a divergence at a level marked in advance, followed by a change in price structure, with a stop beyond the extreme. Even then the combination can fail. Do not confuse delta divergence with SMT divergence, an ICT concept that compares the swings of two correlated instruments rather than price and delta.
Absorption and passive orders
Delta only counts the aggressive side of each trade. The passive side, the limit orders resting in the book, never appears in delta directly, yet it is often what decides whether price moves.
Imagine aggressive sellers hitting the bid again and again at the same price. Delta becomes strongly negative. If a large buyer keeps refilling bids at that price, perhaps with iceberg orders that show only part of their size, price does not fall: the selling is absorbed. When the sellers stop, price can rise quickly on little buying, because the offers above were thin. On the chart, you see strongly negative delta at a low that holds, then a rise with modest delta. Looking at delta alone, you would have read the story backwards.
This is why delta and price can disagree, and why neither is complete without the other. Absorption is only confirmed after the fact, when price moves away from the level; while it is happening, the passive side can also give way.
How trades are classified, and data caveats
Delta depends entirely on deciding which side of each trade was the aggressor. There are two main approaches:
- Bid/ask method. Each trade is compared with the best bid and best ask at the moment it occurred. At or above the ask counts as a buy, at or below the bid as a sell. Depending on the feed, the aggressor side may also be supplied directly with each trade. This is the more precise approach when good quote data is available.
- Up/down tick method. When quotes are missing, a trade at a higher price than the previous trade counts as a buy, a lower one as a sell, and an unchanged price keeps the previous classification. It is an approximation that can misclassify many trades, especially in quiet, back-and-forth markets.
Other caveats:
- different data vendors can deliver different deltas for the same bar, depending on how they timestamp, filter or aggregate trades;
- historical delta may be calculated differently from real-time delta if historical data lacks bid/ask information; on NinjaTrader 8, Tick Replay is used to rebuild tick-based calculations on past bars, provided your data provider supplies historical tick data;
- contract rollovers, session templates and the reset time all change the numbers you see.
Cumulative delta on NinjaTrader 8
NinjaTrader 8 offers an Order Flow Cumulative Delta indicator among its Order Flow+ tools, and its Volumetric Bars show delta per bar and per price. Which license includes them is set by NinjaTrader, so check its official documentation and pricing page.
Whatever the tool, test how it behaves on your instrument and session template in replay or simulation before relying on it, and size positions from your stop distance, for example with the futures position size calculator.
Limitations
- Only half the story. Delta ignores passive orders, cancellations and flows on related markets.
- Scale changes meaning. A delta of +500 is huge on a thin contract and modest on a very liquid one; comparisons only make sense on the same instrument, in similar conditions.
- Hindsight bias. Divergences and absorption are much easier to see on a finished chart than in real time.
- No guarantee. Cumulative delta does not predict price. Treat every reading as a hypothesis with a defined invalidation; trading futures carries a risk of substantial losses (see the risk disclaimer).
The free tools for NinjaTrader 8
 Available
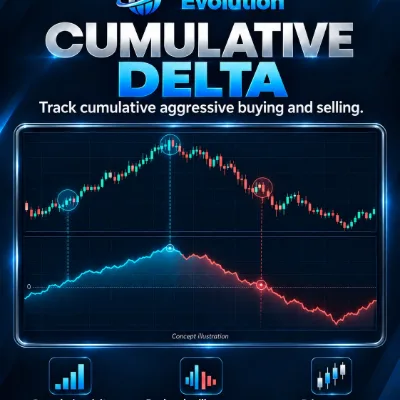
TEVO Cumulative Delta
TEVO Cumulative Delta, a free CVD indicator for NinjaTrader 8: cumulative delta as a line or candles, session resets, zoom and a recent bars table.
Documentation →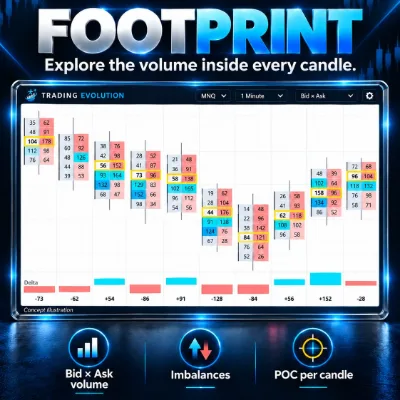 Available
TEVO Footprint
TEVO Footprint, a free footprint indicator for NinjaTrader 8: bid × ask volume per price, diagonal and stacked imbalances, bar POC and a delta table.
Documentation →Frequently asked questions
Is cumulative delta the same as volume?
No. Volume counts all contracts traded. Delta counts the difference between contracts bought aggressively and contracts sold aggressively. A bar can have huge volume and a delta close to zero.
Should cumulative delta reset every day?
It is a choice. A reset at each session makes values comparable from day to day; a continuous total shows longer-term pressure but drifts. What matters is being consistent and knowing which session boundary your tool uses.
Is a delta divergence a reversal signal?
Not on its own. A divergence can last while the trend continues. Traders who use it usually combine it with a level decided in advance, a change in structure and a stop beyond the extreme, and even then the setup can fail.
Why is my delta different from another platform’s?
Aggressor classification, data vendor, trade aggregation, historical data quality and session settings all affect delta. Small differences are normal; compare tools on the same feed and with the same settings before drawing conclusions.
Related concepts and tools
More Order Flow guides
Educational content. These indicators are not investment advice and guarantee no result. Futures trading involves a risk of loss that can exceed the initial investment. Terms of use · Disclaimers