Order book (DOM)
Read market depth in real time and place your orders directly on the price ladder.
Applied in module 08 → Trading Evolution
Algo models, backtesting dashboards, smart-money concepts and precision NinjaTrader 8 indicators.
Beginners welcome · No prior knowledge needed · Content in English
 Official Member of the NinjaTrader Ecosystem
What you learn in our modules and practice in the Order Flow Lab, you then read on futures with NinjaTrader, the award-winning platform of order flow traders.
Partner link. Futures trading involves a risk of capital loss.
Read market depth in real time and place your orders directly on the price ladder.
Applied in module 08 →Volume at the bid and at the ask at every price level: spot absorption, delta and the POC.
Applied in module 08 →Replay a past session to practice the method without committing your capital.
Ideal for modules 03 and 04 →Test your rules on historical data, then automate them: the extension of the quantitative module.
Applied in module 09 →Download it in a few minutes from the official NinjaTrader website.
Download NinjaTrader →Install NinjaTrader and practice in simulation before committing a single euro.
See the platform →Structure, zones, order flow: the Trading Evolution rules, on real markets.
Go to the course →
Keep Trading Evolution as your method and NinjaTrader as your trading workstation: it's the combination we use to read order flow on futures.
Get started with NinjaTraderTrading Evolution is a NinjaTrader partner: we may receive a commission if you open an account, at no extra cost to you. Disclaimers
The Smart Money models we teach, placed straight onto your NinjaTrader charts. Free download, no subscription.
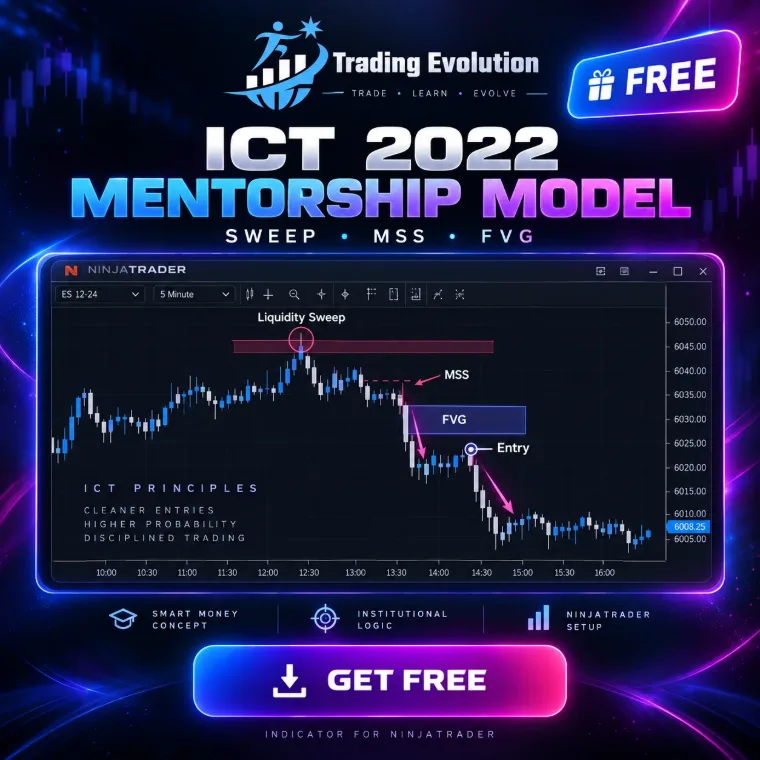
Liquidity sweep, MSS with displacement, then entry on the FVG.
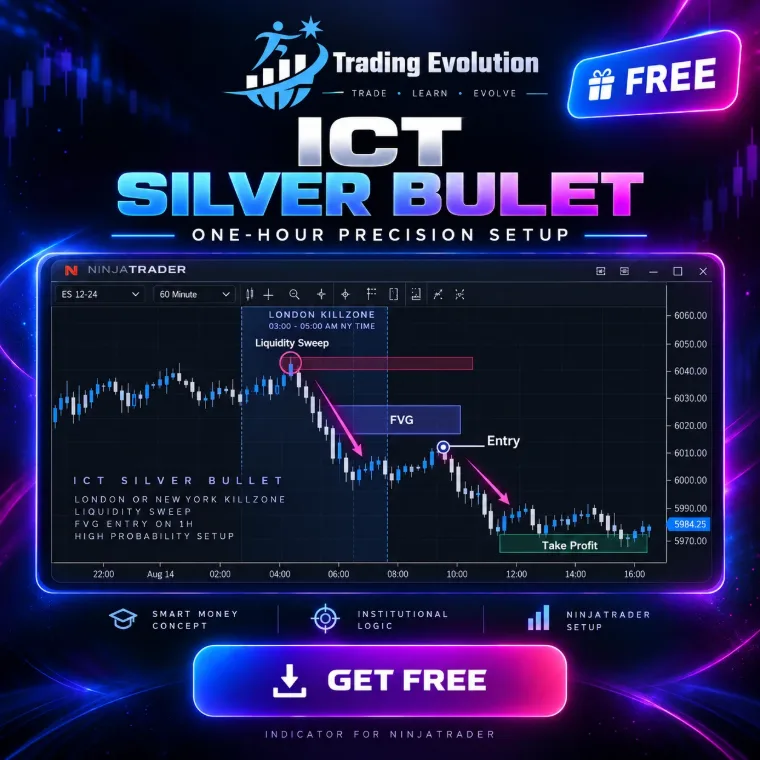
The one-hour window: liquidity grab inside the killzone, then entry on the FVG.
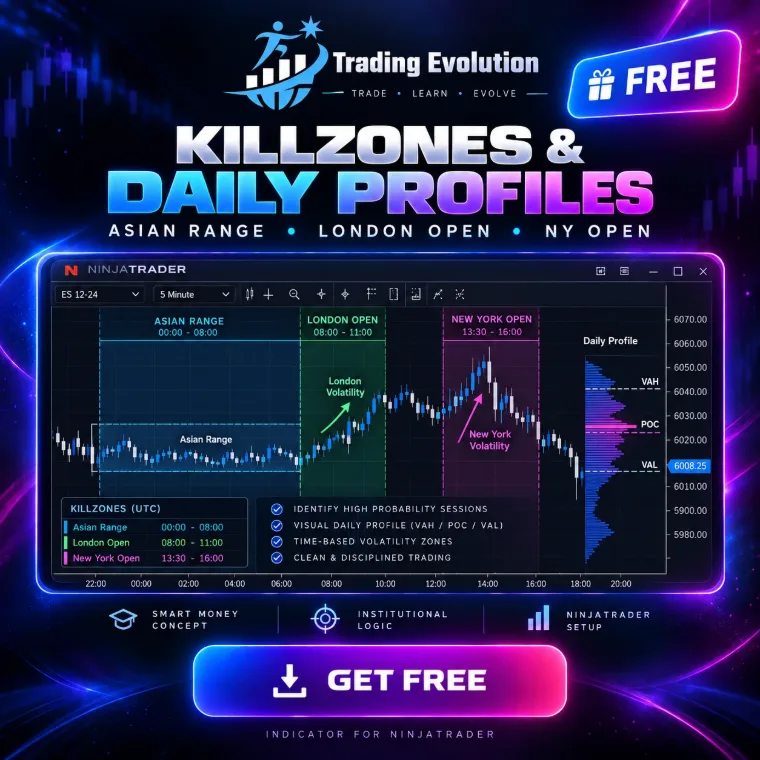
Asian range, London and New York opens, daily profile (VAH, POC, VAL).
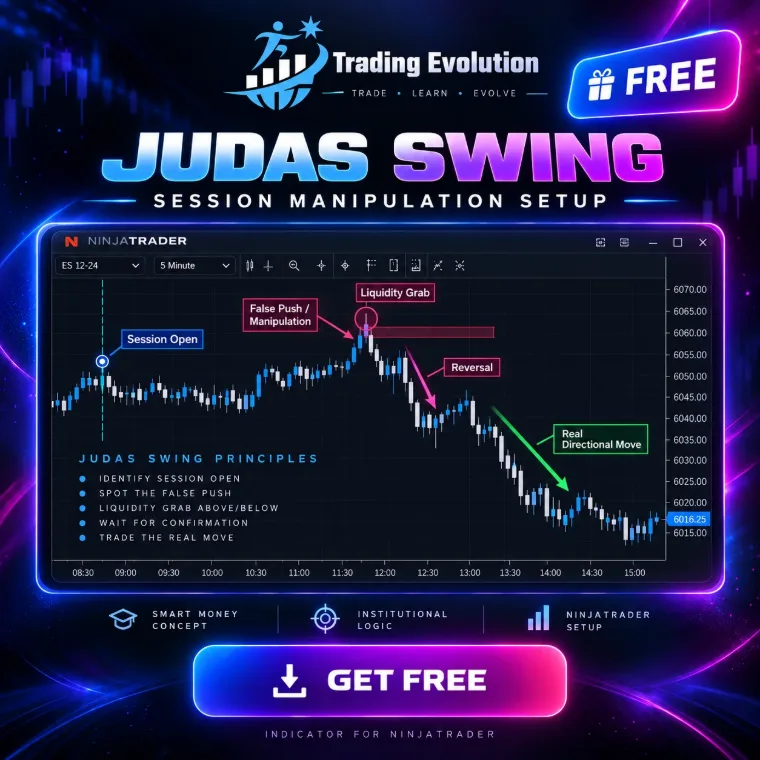
The false start at the session open, right before the real move.
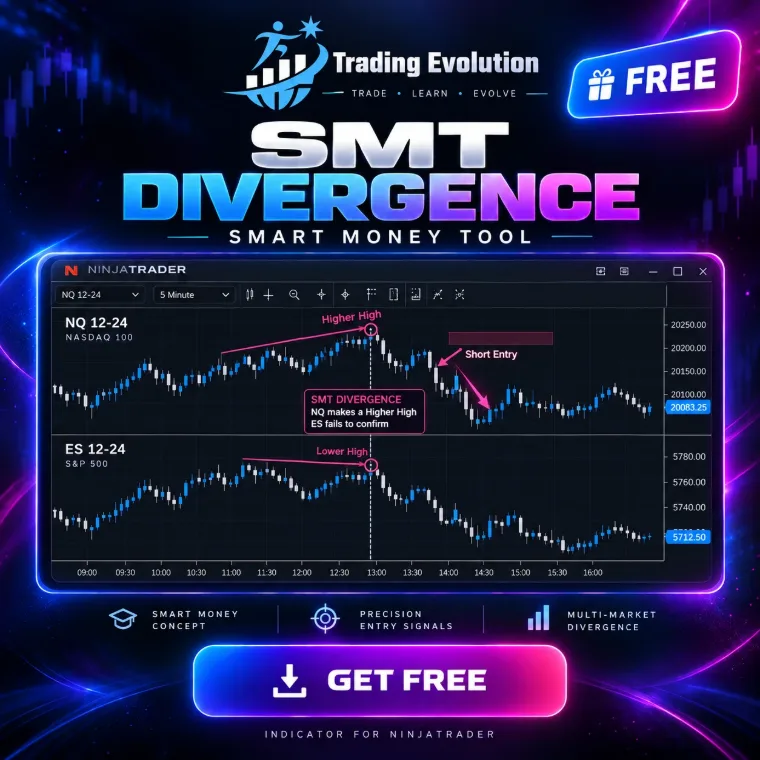
Two correlated markets that stop confirming each other: the smart money footprint.
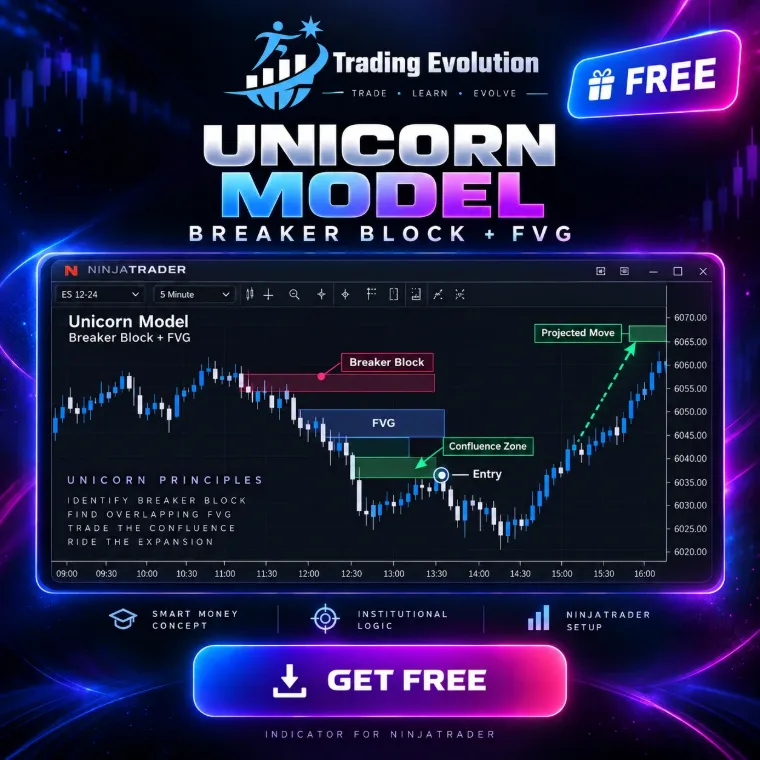
A breaker block and an FVG overlapping: the confluence zone to watch.
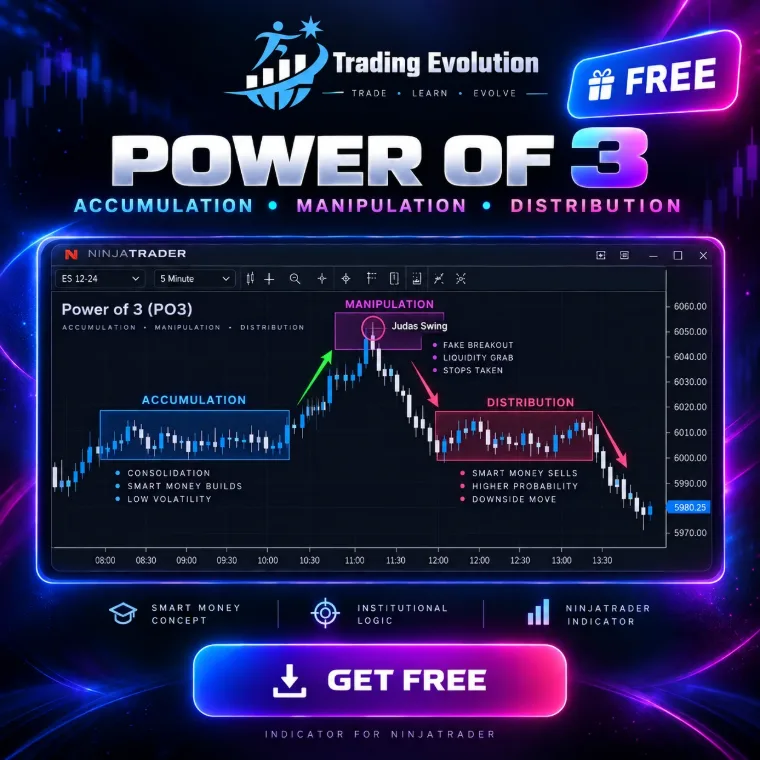
Accumulation, manipulation, distribution: the day split into three acts.
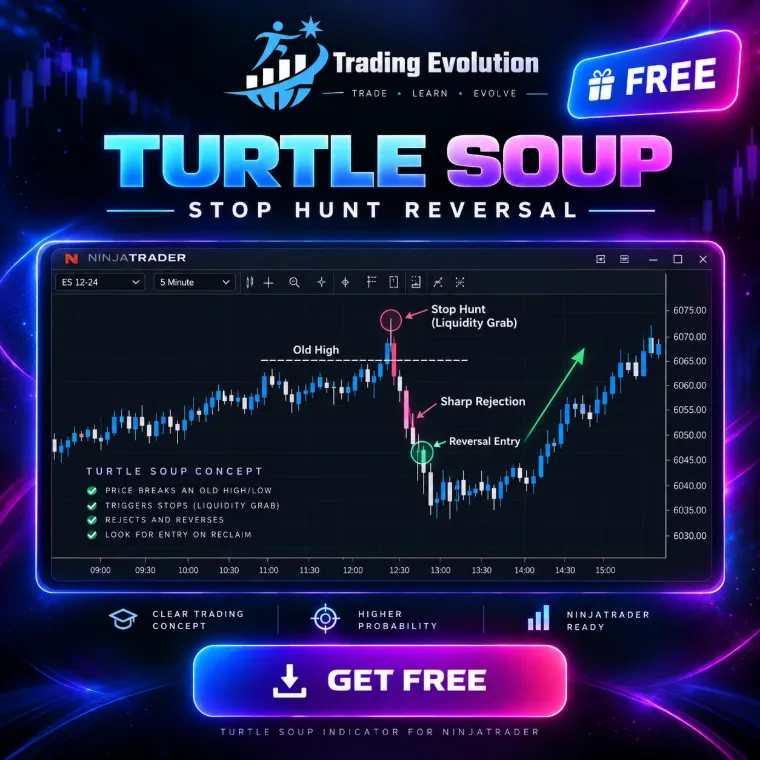
An old high broken, stops collected, then a sharp reversal.
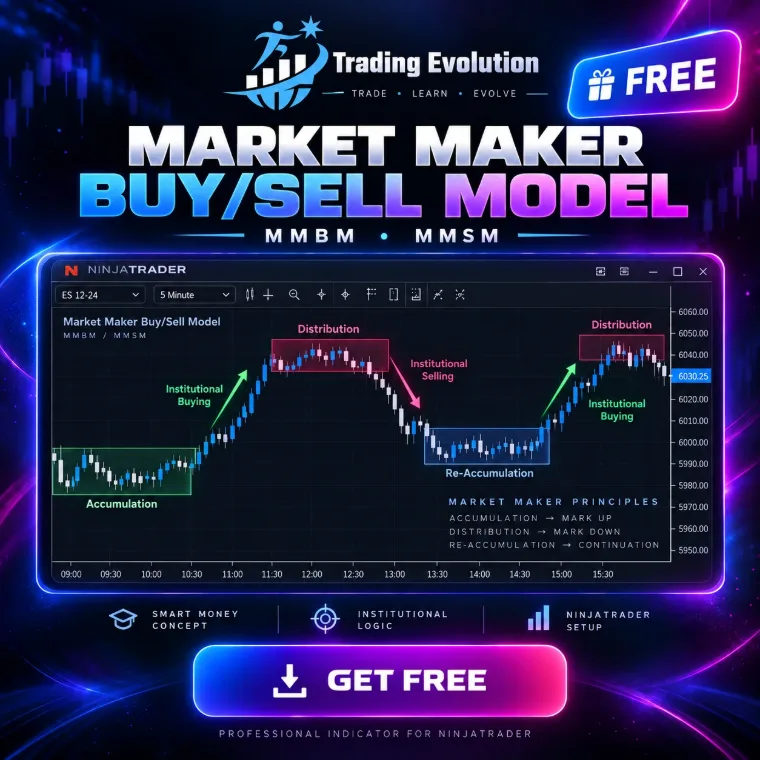
Market Maker Models (MMBM / MMSM): reading the market as a curve (Buy Model or Sell Model). Price steps down towards a major support level (liquidation), then climbs back in mirror through the same steps, letting you exploit the institutional re-accumulation and re-distribution phases.
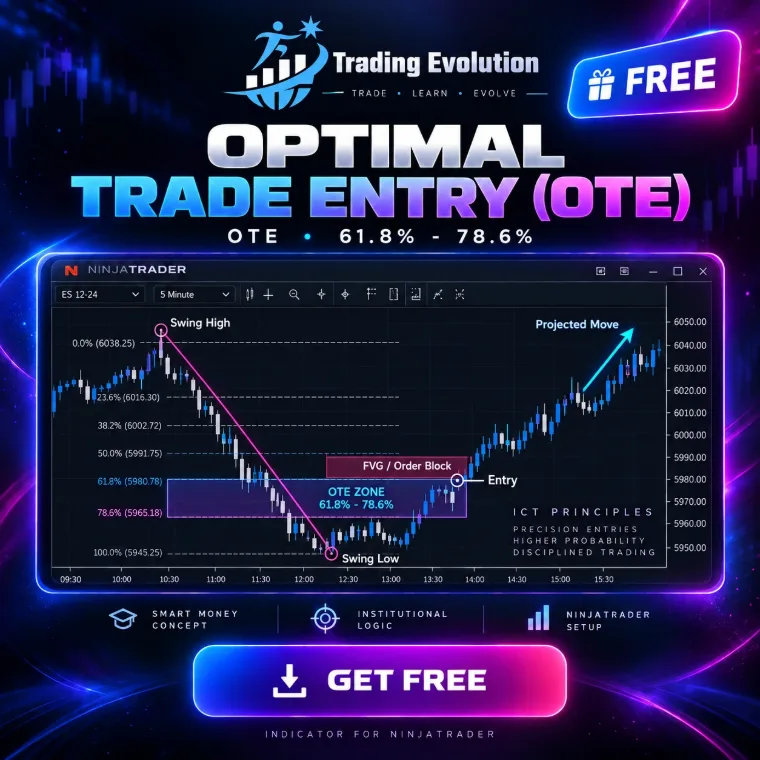
The 61.8% – 78.6% retracement zone, where the best entries sit.
Indicators for NinjaTrader 8, for educational use. They are not investment advice and guarantee no result.
Every module is illustrated, animated and comes with simple rules to apply on your charts.
Price tells a story. You learn to identify highs and lows (HH, HL, LH, LL), breaks of structure (BOS) and changes of character (CHoCH) so you trade in the direction of the market.
“Smart Money” concepts explained simply: where liquidity hides, how the market hunts it, and how order blocks and Fair Value Gaps become precise entry zones.
The market advances in 5 impulse waves, then corrects in 3 waves (A-B-C). You learn the unbreakable rules, Fibonacci extensions and how to anticipate wave 3, the most powerful one.
The SMA smooths price, the EMA reacts faster. The 20 / 50 / 200 periods act as a trend filter, as dynamic support and as a trigger through crossovers (golden cross, death cross).
The levels where price has reacted several times. You learn to draw zones (not lines), to tell a real bounce from a false breakout, and to combine these levels with structure.
Policy rates, inflation, employment and growth drive a currency's strength. You learn to read the economic calendar, anticipate volatility and align your technical position with the macro context.
It combines market structure, moving averages and liquidity zones to give you a clear read: trend, key zones and entry signals. No complicated settings.
A blue / white trend cloud that tells you whether to look for buys or sells.
Order blocks, support/resistance and liquidity zones drawn automatically on your chart.
BUY / SELL arrows when structure, moving averages and the zone line up. Suggested stop and targets.
Get the signals on your phone. Compatible with MetaTrader 5 and TradingView.
Z-score, ARIMA, GARCH, Monte Carlo, LSTM: the models used by quant desks, explained with their formulas and animated live. Module 09 of the course, with an interactive Quant Lab in the app.
Measures how many standard deviations price has moved away from its moving average. Beyond ±2σ, a return to the mean becomes statistically likely: sell high, buy low, exit when it crosses zero.
Log returns, stationarity (ADF), model selection: ARIMA for the series, GARCH for volatility.
Point forecast + confidence interval, or a full distribution via Monte Carlo.
LSTM and recurrent networks on a rolling window, validated against a naive baseline.
Sharpe, drawdown, profit factor, walk-forward: we only deploy what survives out of sample.
Forex first, then the markets that respond best to the method.
Four data points to track every month. The chart updates when you switch indicator.
Illustrative values for educational purposes. Live data in the calendar below.
Fed, ECB, BoE, BoJ. A rate hike draws capital into the currency. The tone of the statement matters as much as the number.
Rising inflation pushes the central bank to tighten. The market reacts to the gap between the published figure and expectations.
First Friday of the month. The most volatile report on the calendar: trade it after the reaction, never during it.
A PMI above 50 = expansion. GDP confirms the trend and steers rate expectations.
Live news, and our weekly analysis format: macro context, structure, trade plan.
Context: cautious ECB, dollar waiting on CPI. Plan: buy on a retest of the 1.0800 – 1.0820 zone, invalidation below the last HL.
Context: US yields pulling back. Technically, wave 3 in progress above the EMA 20. Target: 1.618 extension, stop below wave 2.
Context: tech earnings week. Equal highs swept, then a change of character. Looking to sell at the unfilled FVG.
Sample analysis formats for educational purposes. This is not investment advice.
Vocabulary, candles, market structure. You understand what you're looking at before you click.
Price action + ICT + moving averages, validated by the economic context. A checklist, not gut feeling.
Install the indicator, follow the zones and signals, log every trade and improve your consistency.
Every concept is drawn and animated. You see the pattern before you read about it.
We combine three approaches into one clear checklist. Fewer indicators, more discipline.
1% per trade, risk/reward ratio, journal. It's the foundation, we don't skip it.
Weekly analysis, live sessions, Q&A. You don't learn alone.
Create your account with Google to enter the app: indicator, this week's analysis, course and progress tracking.
Google verifies who you are. We only receive your name, email, avatar and Google account ID. Free account, no card required.
Free · Google account required · You can sign out at any time
MT5 file and TradingView script, with the installation guide and settings per market.
Get it on TelegramEUR/USD, XAU/USD, indices: macro context, structure and trade plan published every Sunday.
See the analysisLive sessions, Q&A and real-time indicator alerts on Telegram.
Join the groupTick off completed modules. Saved on this device.
0 / 8 modulesYes. Module 1 starts from scratch: what a pip, a lot, leverage and sessions are. You then move on to market structure and advanced concepts at your own pace.
Price action reads raw price (structure, candles, zones). Technical analysis adds calculated tools (EMA, SMA, RSI, waves). Fundamentals explain the why (rates, inflation, employment). The method combines all three.
The Trading Evolution indicator runs on MetaTrader 5 and TradingView, with an installation guide and recommended settings per market. The free ICT indicators are NinjaScript files for NinjaTrader 8.
Forex (majors and minors), gold and silver, US and European indices, oil and the main cryptos. The method applies wherever there is liquidity.
Trading Evolution is an Official Member of the NinjaTrader Ecosystem. It's the platform we use for the Order Flow module, because it gives access to the order book, the footprint and real volume on futures. Links to NinjaTrader are partner links: we may receive a commission if you open an account, at no extra cost to you. Details are in the disclaimers at the bottom of the page.
Yes. They are free NinjaScript (.cs) files, with no subscription, and you can read them before compiling. Every available indicator has its own documentation page: how it works, settings and installation. NinjaTrader 8 remains third-party software with its own terms.
No. Trading Evolution is educational content. Margin trading carries a high risk of capital loss. Never trade with money you need.

Join the course, get the indicator and follow the analysis every week.
A real Google account is required: no password to create, no card. We only receive your name, email, avatar and Google account ID.
Sign-in secured by Google
By continuing, you accept our terms of use and our privacy policy.
These indicators run on the NinjaTrader platform. Go through our link to continue.
Download NinjaTrader Partner link · DisclaimersThis step unlocks as soon as you have opened NinjaTrader in step 1.
Download the fileThe file for this indicator is coming to this page very soon.
Installation: put the file in Documents\NinjaTrader 8\bin\Custom\Indicators, then compile in the NinjaScript editor (F5).